- Development of a GIS dataset containing 21 years of tournament outcomes
- Parsimonious a priori model selection and inference strategy using the Akaike Information Criteria (AIC) statistic for determining the best-fitting model
- Results suggest that RPI and tournament seed are much more effective means of predicting game outcomes than distance
- Furthermore, the results suggest that the difference in seed is the best predictor covariate, of those evaluated
- The outcome was not completely unexpected, since tournament seed and RPI are closely related. In fact the Selection Committee uses RPI as a major part of their criteria for developing team seeds, and subsequently team pairings for tournament games
- Esri Conference Proceeding (PDF)
- Spatial Madness (ArcUser Online)
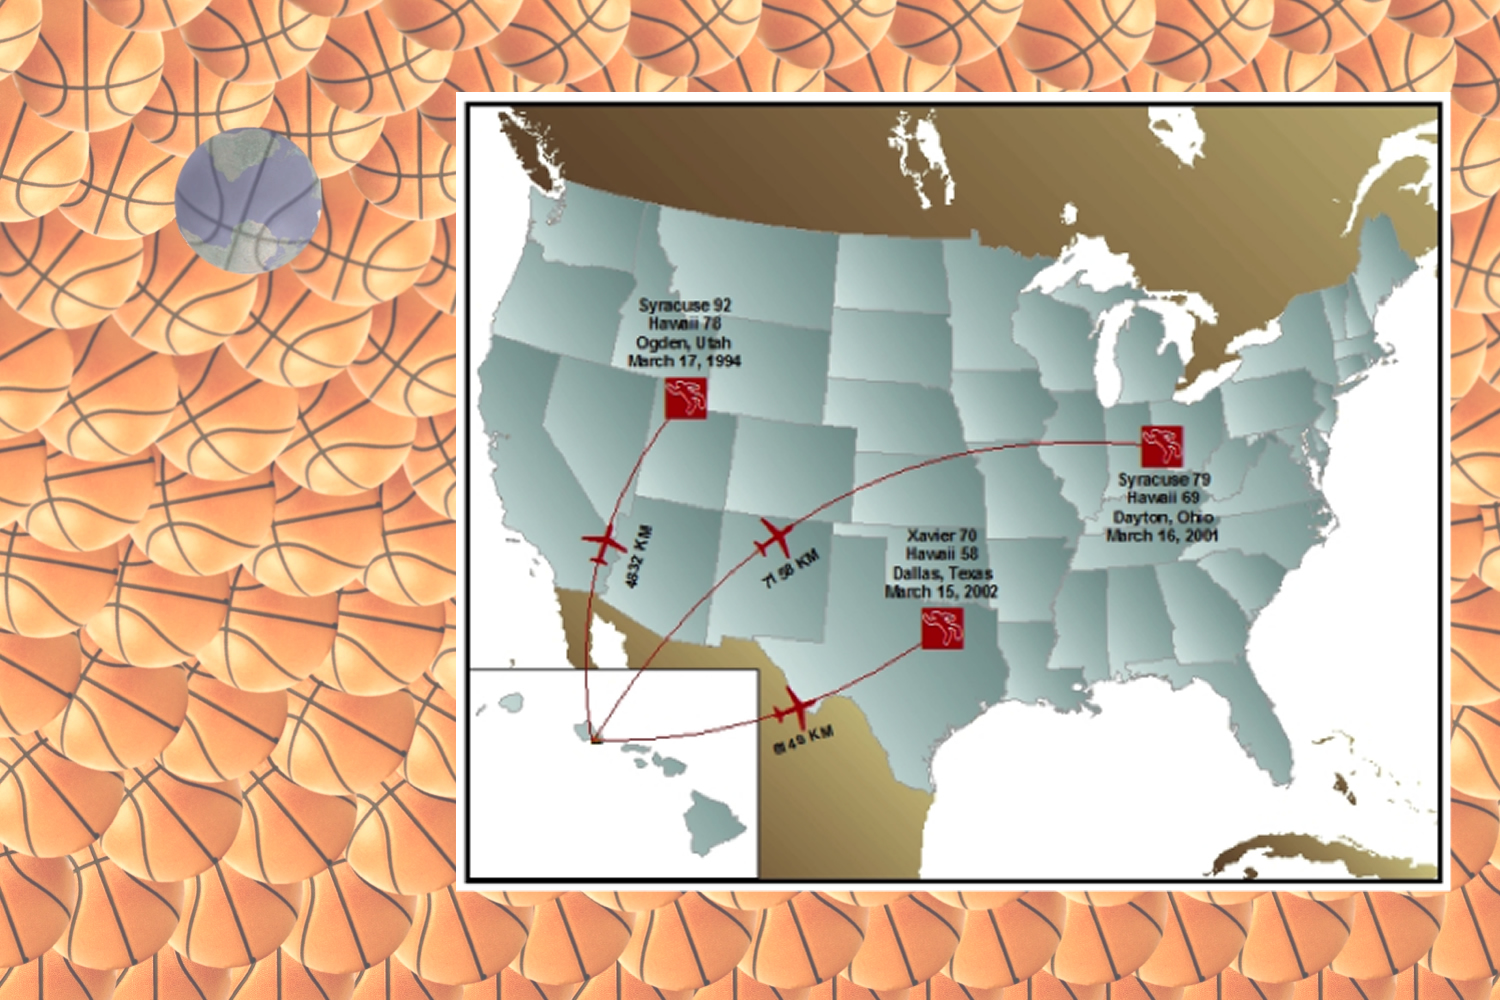
Spatial analysis to investigate whether or not there is a spatial correlation between the distance of competing teams in the NCAA Men's Basketball Tournament to their games sites, based on either their seeding and/or the Vegas lines, relative to their success in the Tournament games.
Highlights:
Links:
- ArcGIS for Desktop
- Hawth's Analysis Tools for ArcGIS
- R